Performance guide
MHX performance reporting is designed for reproducible engineering comparisons, not for hardware-independent pass/fail claims. The active benchmark matrix is small enough for CI and produces artifacts that can be downloaded and compared between commits.
Run timing artifacts
mhx benchmark timing --outdir outputs/benchmarks/timing --repeats 3 --warmups 1
Expected files:
outputs/benchmarks/timing/timing.jsonoutputs/benchmarks/timing/timing.mdoutputs/benchmarks/timing/figures/timing_summary.pngoutputs/benchmarks/timing/manifest.json
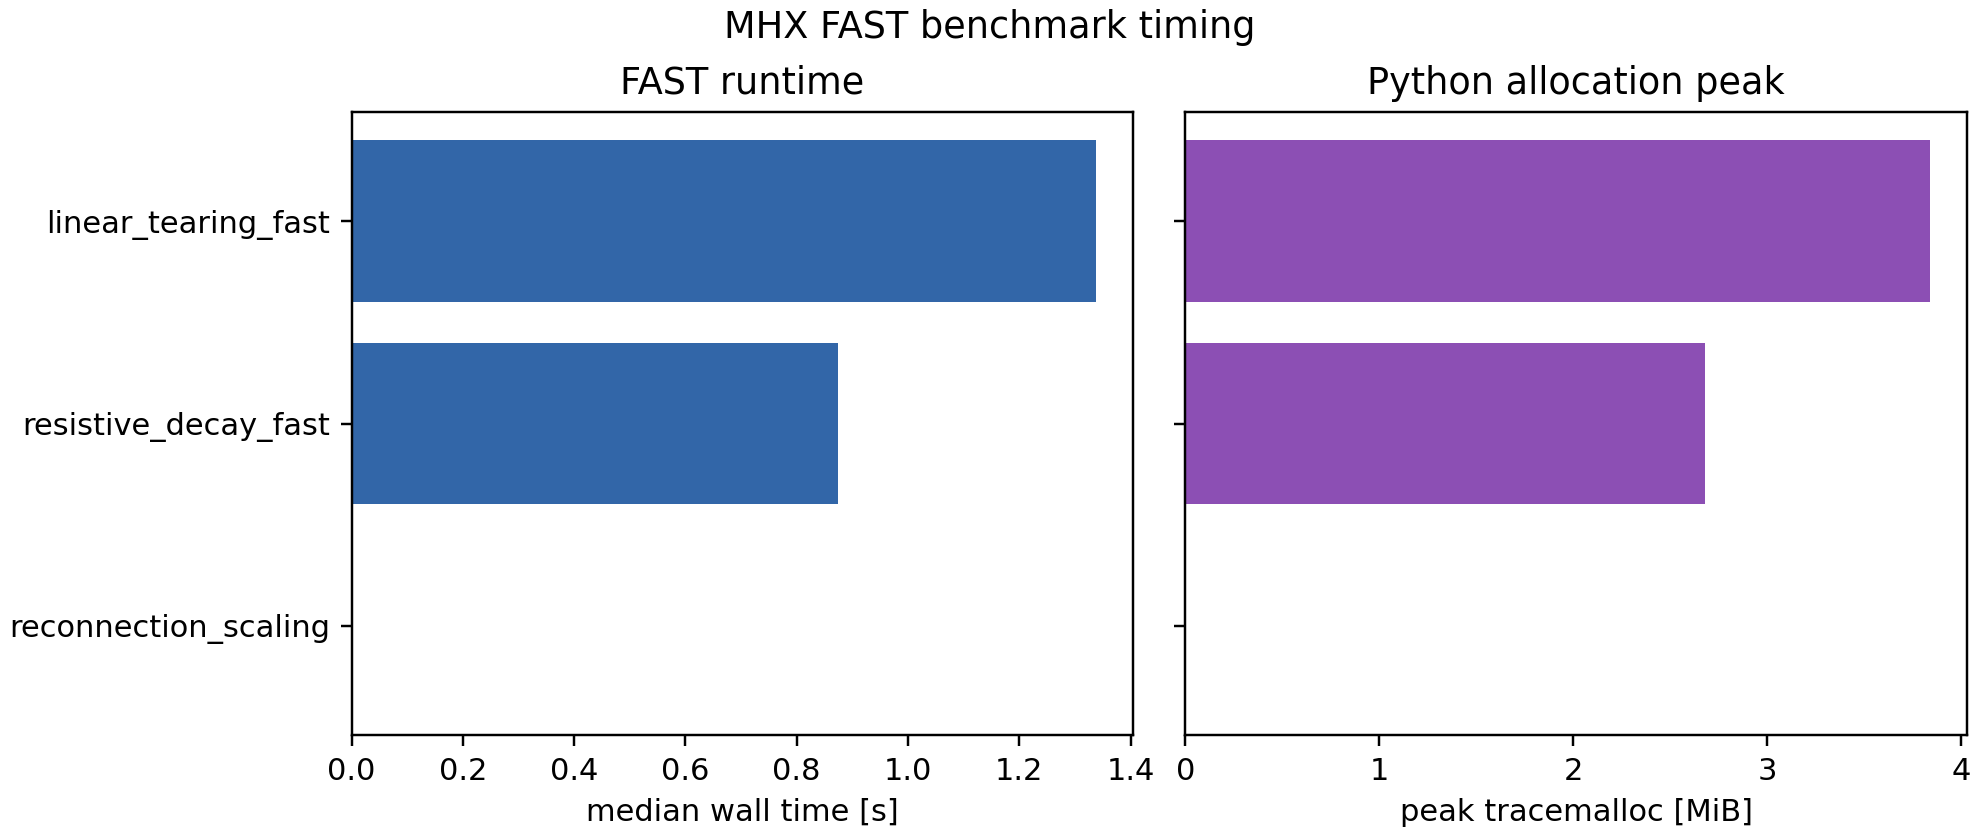
The JSON schema is mhx.benchmark.timing.v1. Each case records raw repeat
durations, median/min/max wall time, peak Python allocations from
tracemalloc, and environment metadata including Python, JAX, NumPy, and the
selected JAX backend.
Current cases
Case |
What it exercises |
|---|---|
|
Config loading, periodic spectral derivatives, RK4 stepping, diagnostics, and reduced-MHD RHS evaluation. |
|
Exact Fourier-mode resistive diffusion gate with numerical error diagnostics. |
|
Analytic FKR, Sweet-Parker plasmoid, and ideal-tearing scaling scaffolds. |
Interpreting the numbers
Compare timings only on the same machine class or the same GitHub Actions runner type.
CI verifies finite positive timings and required artifact files; it does not enforce absolute runtime thresholds.
tracemallocreports Python allocations, not GPU/TPU device memory. Future accelerator benchmarks should add backend-specific memory probes.JAX compilation and caching can dominate small cases. Use
--warmupsto remove first-call overhead when comparing local changes.
Cheap CI coverage
The documentation/CI checks are intentionally cheap enough to run on every push:
python -m ruff check src tests examples toolscatches import/style drift before tests start.python tools/check_legacy_imports.pyprevents new imports from the archived implementation.python -m pytest tests/test_docs_links.pychecks that required docs pages are in the Sphinx toctree and that reviewer-facing source links still point at repository paths.python -m pytest tests/test_readme_media.pychecks README GIF links, compactness, visual-QA metadata, and minimum simulation durations for landing page media.sphinx-build -W -b html docs docs/_build/htmlbuilds docs with warnings as failures.
The expensive physics artifact matrix remains in benchmark-artifacts. That
job records timing artifacts, but still avoids absolute runtime thresholds
because GitHub-hosted runner performance is not stable enough for hardware-free
claims.
Performance knobs
The active TOML config exposes the first controls users should tune:
[mesh]
shape = [32, 32]

[time]
t1 = 0.1
dt = 0.01
save_every = 1

[numerics]
enable_x64 = true
enable_jit = true
Larger mesh.shape values increase spectral FFT cost and trajectory storage.
Smaller dt improves temporal resolution but increases the number of RHS
evaluations. Larger save_every reduces IO and plotting memory. X64 is used in
physics validation gates; exploratory performance runs may use X32 after a
regression check confirms diagnostics remain stable.
Long-run trajectory memory
The fixed-step RK4 integrator stores only saved states. Internally it advances
save_every RK4 steps inside each saved-sample scan chunk, rather than storing
all internal steps and slicing afterward. This matters for long nonlinear
campaigns: a 160×160, t_end=220, dt=0.02, save_every=110
double-Harris replay initially requested about 2.1 GiB for one full internal
trajectory buffer on the office RTX A4000 node. After chunked saving, the same
bounded validation run completed and wrote 101 saved samples with finite
diagnostics.
Practical guidance:
Increase
save_everywhen the analysis only needs coarse movies or growth histories.Keep
dtcontrolled by physics/stability, not by output cadence.For GPU runs, set
XLA_PYTHON_CLIENT_PREALLOCATE=falsewhen sharing a GPU.Treat very long reverse-mode differentiable runs separately: checkpointing or custom adjoints are still needed for memory-efficient gradients through production trajectories.